ONE OF THE TOP FULL-SPECTRUM SPECIALIST REMUNERATION AND REWARD CONSULTANCIES IN AFRICA

THE LEADING WORKPLACE FEEDBACK TECHNOLOGY SOLUTION
ONE OF THE TOP FULL-SPECTRUM SPECIALIST REMUNERATION AND REWARD CONSULTANCIES IN AFRICA
THE LEADING WORKPLACE FEEDBACK TECHNOLOGY SOLUTION
Companies with high employee engagement levels grow EPS at a much faster rate (28%) compared to companies with low employee engagement levels (decline of 11%)
Towers Perrin, Closing the Engagement Gap: Global Workforce Study
Companies with high employee engagement levels returned 19% more to shareholders than average compared to companies with low employee engagement levels (44% below average)
(Hewitt Associates)
Increased levels of employee engagement has been correlated with greater customer satisfaction and increased productivity, as well as decreased turnover, lower absenteeism, and fewer accidents.
(Business-unit-level relationship between employee satisfaction, employee engagement, and business outcomes: A meta-analysis. Journal of Applied Psychology)
When your talent leaves, they need to be replaced. The true cost of replacing talent is 150% of the annual salary of middle-level employees and up to 400% for specialized, high-level employees
(Ross Blake, Employee Retention: What Employee Turnover Really Costs Your Company)
For the first time, we’re running a National Engagement Index to measure the levels of engagement across all companies nationally. Discover the levels of employee engagement in your company! Discover how likely your talent is to leave in the next year! Just 8 quick questions – and it’s COMPLETELY FREE TO PARTICIPATE! All employee and company details and results will be kept strictly confidential.
For each of the 7 components, you receive a detailed breakdown of the results across your whole employee base. An example appears below.
You'll get a similar chart for each of the 7 components of our employee engagement model. 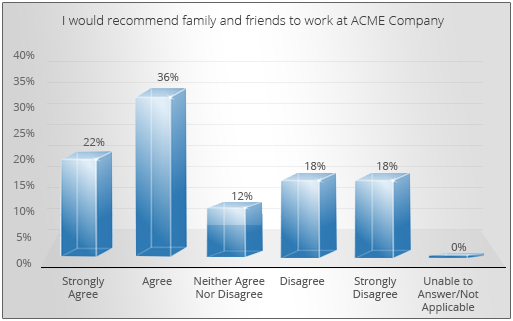
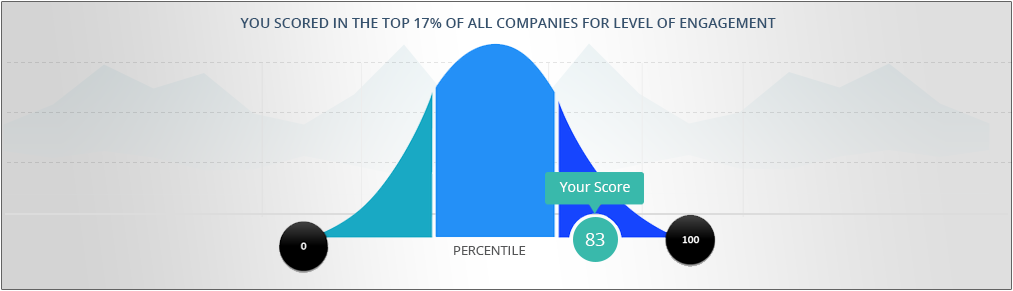
In addition, we show the overall engagement levels for all employees in your organization.
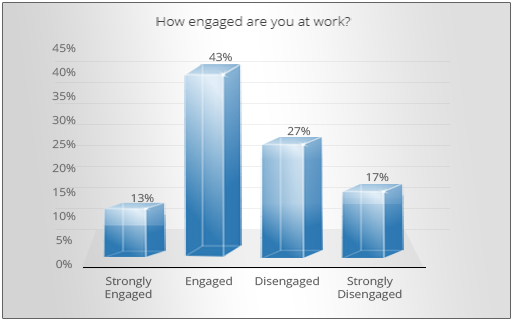

Our analysis will show you exactly how many employees are in each of the following categories:
I am actively looking for a job. I have been in contact with a recruitment agent, or sent my resume out to one or more companies.
I am actively scanning the job boards for new opportunities, but I haven’t contacted any recruitment agents yet, nor have I sent my resume out to anyone yet.
I am not looking for a new job yet, but I do plan to start looking in the near future (say, in the next 6 months).

I am not looking for a new job and nor do I plan to in the near future. However, if I were approached with an interesting job opportunity, then I would definitely investigate further.
I am not looking for a new job, and nor do I plan to in the near future. I am also not really interested in any external job oppportunities which may arise in the near future.
The FeedbackRocket Employee Segmentation model is a powerful method to segment your employee base.

The FeedbackRocket Employee Segmentation model is based on the two variables measured previously:
The two variables are plotted against each other in the form of a 2x2 matrix, as shown in the diagram below:
ENGAGED

Committed to the company, loves the work, supports the business
and its mission.
This employee is loyal, enjoys the job, and actively promotes the company.

Supports the business and its mission, but driven to seek new
opportunities and growth.
This employee drives the business forward, but needs new challenges.
DISENGAGED

Does not enjoy the work or the company, but intends to stay anyway.
This employee “sucks the blood” out of the organization, and infects others
with negativity.

Does not enjoy the work or the company, but intends to leave soon.
This employee has already left in his or her own mind,
and is simply going through the motions until they can resign.
ENGAGED
DISENGAGED